Autocast: automatic anycast site optimisation
Automatically selecting the optimal anycast locations for fast .nl response times worldwide.
Automatically selecting the optimal anycast locations for fast .nl response times worldwide.

Our DNS operators use IP anycast to make .nl available throughout the world with improved resilience and faster response times. But which points of presence should they choose to optimise the latency of their anycast deployment? Oftentimes, operators manually test and tweak anycast site selections over many iterations. In this blog we describe Autocast: a data-driven heuristic method to approximate the optimal selection of any number of anycast sites. The novel aspect of our method is that we only use IP unicast measurement data. With Autocast, we can predict the median latency of resolvers to a proposed anycast deployment with millisecond precision, without having to do anycast BGP announcements.
Anycast is a routing mechanism where service operators run their service at multiple locations throughout the world using the same IP address. That means clients all over the world will connect to the same IP address but may be routed to different servers, thereby spreading the traffic load and decreasing client-server latency.
Internet traffic is routed across routers running BGP, a policy-based routing protocol that, on the surface, is quite unpredictable and opaque. In theory, BGP will route internet traffic to its destination via the shortest available path, which in the case of anycast would be the topologically closest site. In practice, that is not always the case. Provider-specific routing policies and hidden internal networks make it impossible to say with certainty to which anycast location a client will be routed.
SIDN operates an anycast platform for .nl, which spans 10 locations all around the world. It serves our clients: DNS resolvers across the internet that query .nl domain names. Like many DNS operators, we run our name servers on a third-party bare metal infrastructure that lets us dynamically scale capacity to meet changing demands, such as to react to DDoS attacks. The providers of such infrastructures typically offer dozens, if not hundreds of points of presence (PoPs) worldwide. That raises an important question: which PoPs should we choose to host our .nl authoritative name servers to ensure good coverage, low latency and high resilience? Especially client latency – the round-trip time (RTT) from client to server – is hard to predict, yet keeping it as low as possible is critical for a smooth .nl experience globally.
There is a glaring problem with selecting a good set of anycast sites from all the PoPs that are available at our infrastructure provider(s): we don’t know for certain which clients are routed to which anycast site (defining the “catchment” of that site), and with what latency. To quantify how good an anycast site selection is, we would have to deploy it and measure the performance. To do that for many, let alone all possible site selections is utterly infeasible: a selection of 10 from a total of 40 PoPs yields 847 million possible combinations! Hence, we have to approximate the expected performance of a selection of anycast sites somehow, without having to deploy it.
Today, we manually choose our initial anycast deployment locations based on best common engineering practices found in literature, as well as knowledge of our customer base, then continually tweak it to improve performance. For example, we might choose 1 or 2 PoPs on each continent; a popular strategy to ensure global coverage. However, while selecting PoPs based on their geographical distribution is a solid strategy, it’s not the ultimate metric for success. We’ve seen in experiments that geographical distance is a bad predictor of the connection latency (Pearson’s r = 0.45).
Another anycast site selection strategy is to simply use all the points of presence an infrastructure provider offers. However, that would lead to high costs, and the global latency may even be higher compared to a well-selected smaller set of PoPs, due to a higher probability of traffic being routed to a distant PoP by BGP’s often politically and commercially motivated policies.
So, anycast service operators might reach a more optimal anycast deployment faster and with more certainty by following a data-driven method.
In this section we describe Autocast (Automating anycast), our proposed method for approximating an anycast site selection which optimises global client latency using unicast measurement data.
We define 3 requirements for our selection method:
Fast results: The algorithm provides a recommendation within minutes.
Accurate predictor: The predicted client latency closely matches real-world performance.
Rooted in operations: our DNS operators will want to use this method.
Our approach is unique because our proposed method requires just a single unicast measurement, which makes it both time and cost-efficient, since infrastructure providers may charge extra for announcing anycast IP space in a region. Those features mean that our method is unlike previous work on anycast site optimisation, where multiple anycast measurements are required to make pairwise comparisons of anycast sites to reach a preference order, on which to base the PoP suggestions.
To enable us to make a prediction about the performance of an anycast deployment. we make 2 assumptions, based on the properties of BGP. We test and defend these assumptions in the results section.
Assumption 1: clients are routed to the anycast site with the lowest latency. This assumption is based on the “shortest path” policy in BGP, which we translate to “smallest round-trip time (RTT) from client to server”. We know this assumption doesn’t always hold – it can be seen as the best-case scenario – but it’s the best heuristic we have. We illustrate this assumption in Figure 1. There we assume the client in Italy is routed to the server in Amsterdam, because it has the lowest latency.
Assumption 2: the anycast and unicast latencies to the same anycast site are the same. This assumes we can measure the latency to an anycast site by measuring the latency to the unicast IP address of that site. These latencies should be the same, since traffic is routed to the same endpoint on the internet. However, it could be the case that BGP routes this traffic differently. Figure 2 visualises this: the latencies to 2 different IP addresses of the same server should be the same.


With those assumptions in mind, it’s time to measure the unmeasurable: the performance of any imaginary anycast deployment. We can estimate the performance of an anycast site selection in 2 steps:
We first measure the latency from all our clients to all possible anycast PoPs an infrastructure provider (or providers) offers, which are locations where we can potentially deploy our anycasted .nl name servers. That results in a dataset with the latencies between all resolvers and all PoPs.
We can then simulate endless “imaginary” anycast deployments by selecting any subset of PoPs. To estimate the performance of that imaginary anycast deployment, we discard all latency results from step 1 that are not related to any of the selected PoPs. Following assumption 1, we predict each client will connect to the PoP with the lowest latency in our imaginary deployment. Using the predicted catchment of each PoP, we estimate the overall median latency of the deployment, without having to deploy it.
In the case of our authoritative DNS service, we know who our clients are: the resolvers that query .nl domain names. We have that data in our DNS analysis platform ENTRADA. If the clients are unknown, we can use a generic IP hitlist to target many networks, covering the global internet. To measure the latency from each client to each possible PoP, we spin up a virtual machine at all those PoPs and send out an ICMP ping to each client from each of those locations. The measurement tool MAnycastR automates that process and makes it very easy. With most infrastructure providers offering an API through which you can start and stop resources, we can spin up all the VMs, perform our measurement, and remove the VMs within a few minutes, incurring virtually no cost.
With our latency measurement results in hand, we can simulate the performance of any virtual anycast deployment. For example, we evaluate the anycast site selection [Amsterdam, New York, Singapore] by keeping only the step 1 latency results from and to those sites and selecting the fastest site for each client. We then take the median latency over all clients as our expected (optimistic) performance score. We can even weigh our metric by the number of DNS queries each resolver sends, prioritising more important clients.
At this point, we have an optimisation problem at our hands: millions of possible solutions (sets of potentially suitable anycast sites) in our search space, and a method to evaluate each solution (the median client latency). Our task is to find the solution with the lowest median latency. From assumption 1, it follows that adding any additional site to our selection can only improve the estimated performance of that imaginary anycast deployment and never make it worse. That is not always the case: adding a bad PoP could in fact worsen the global performance due to the intricacies of BGP; it could steal traffic from a PoP with lower latency. Hence, to work around that limitation, we limit our search space to a fixed number of sites, otherwise the solution would always be “just use all of them!” We can repeat the optimisation process for any number of sites we might want to include in an anycast deployment.
Even simply estimating the performance for each possible subset of anycast sites – remember, there are millions – would be a computationally enormous task, so we must approximate the optimal solution with an optimisation algorithm. To solve the optimisation problem, i.e. to find the subset of anycast sites with the fastest overall response time, we apply a probabilistic method called Simulated Annealing. Each step of the algorithm changes the selection of PoPs by swapping one for another. If the resulting solution is more optimal than the previous, it is kept for the next step. Worse solutions are occasionally accepted, based on a probability which decreases every step, to encourage exploration and avoid getting stuck in local minima. The output of the algorithm is the best anycast configuration (a selection of locations) it could find, and the corresponding predicted overall latency from clients.
Our DNS operators are presented with the suggested anycast deployments and may choose to deploy name servers on the suggested locations at their discretion. The resulting suggested deployments from Autocast are not automatically deployed to production.
Time to test our method! We took inspiration from our production DNS deployment setup for .nl to be able to automatically deploy and test many anycast deployments on our own anycast testbed. We tested our method with Vultr, an infrastructure provider that allows customers to announce their own IP prefixes on the internet. Vultr has 32 global PoPs and an API through which we can programmatically create and delete virtual machines with a predefined configuration file. Our software for deploying and managing the infrastructure is available on GitHub.
Step 1: The first step is to obtain the round-trip times (latency) from all 32 Vultr PoPs to all clients. We define our clients as all DNS resolvers that have sent at least 100 .nl DNS queries the day before, which results in roughly 230K IPv4 addresses and 73K IPv6 addresses. We programmatically deploy our preconfigured measurement VMs on all Vultr’s PoPs and start a ping measurement to our client list. We limit the MAnycastR tool to send at most 1000 probes per second. After about 10 minutes, the measurement is done and we have 7 million responses, a response rate of about 73%.
Step 2: With the unicast latency measurement results, we run our optimisation algorithm to approximate optimal anycast deployments for 3, 5, 7, 11, 13, 15 and 17 PoPs. We have established by empirical testing that adding more than 17 PoPs to our anycast deployment does not improve the global latency in practice. We optimise for the median latency of all resolvers multiplied by the logarithm of the resolvers’ query count, thereby balancing a metric of resolver importance and broad coverage.
Evaluate deployments: To evaluate our method, we deploy the resulting configurations one by one and perform another ping measurement to our clients; this time using the shared anycasted IP addresses of the measurement machines as the ping source. As a result, the clients respond to one of the announced locations, revealing the catchments and true latency of the deployment.
We repeat our experiments with anycast deployments generated with random selections of PoPs for comparison.
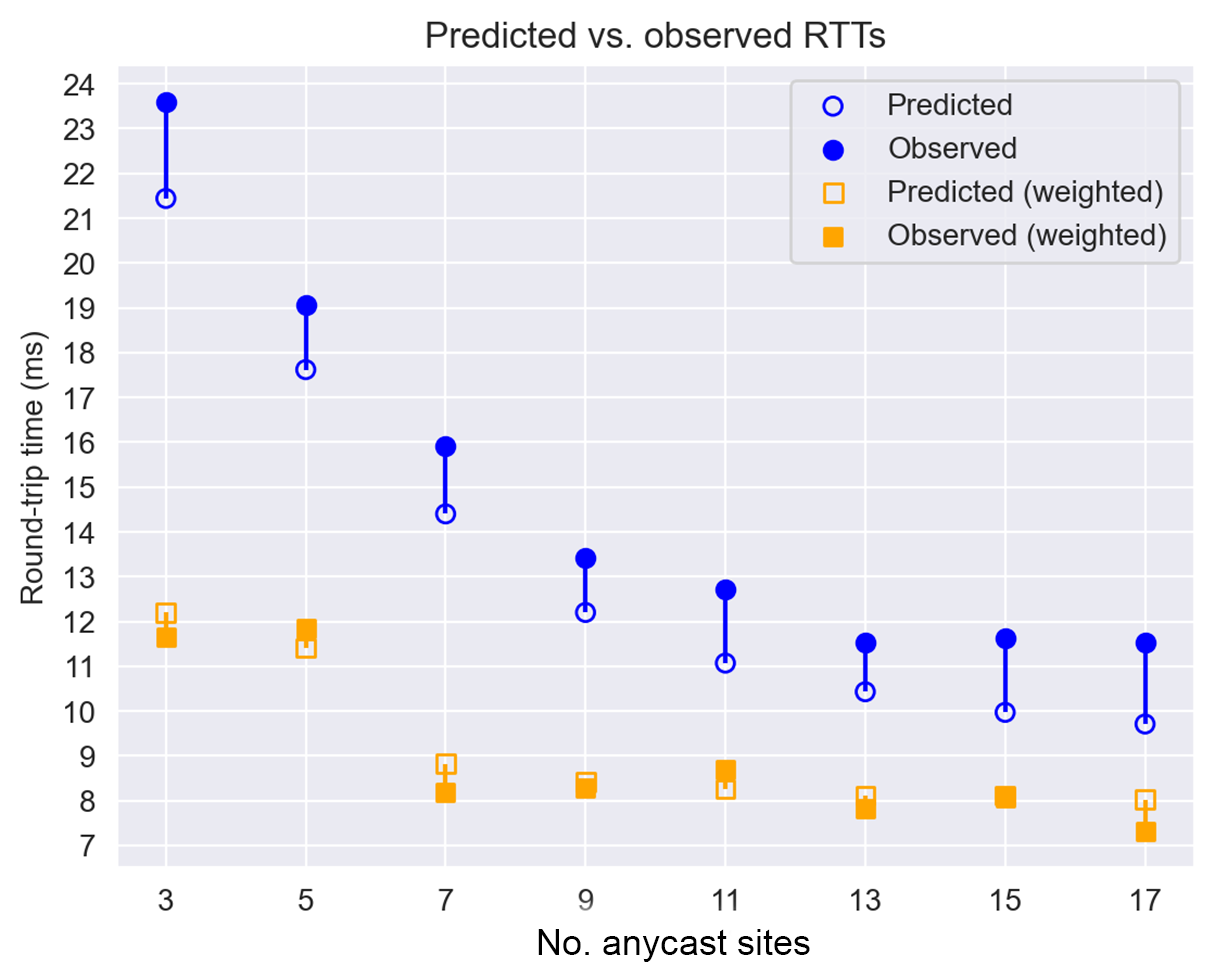
In Figure 3 we plot for each tested anycast deployment the predicted median RTT based on the unicast latency measurement with all 32 of Vultr’s points of presence and the true observed latency from the actual anycast deployment. We also show the median latencies when weighing each resolver’s latency by the number of queries it sends (in orange).

We see that the predicted RTTs closely match the observed RTTs. The mean difference between the predicted and observed RTTs is 1.57ms. When weighing the resolvers by the number of DNS queries they send, the predicted round-trip time differs a negligible -0.19ms from the observed times. Those results indicate we can indeed use our method to obtain anycast deployments with low RTTs and even determine how many sites we wish to deploy without dipping into diminishing returns. Even more so if we know who our clients are and their relative importance. From the results, we see that having more than 11 or 13 PoPs results in little to no improvement, indicating it may not be worth the additional cost.
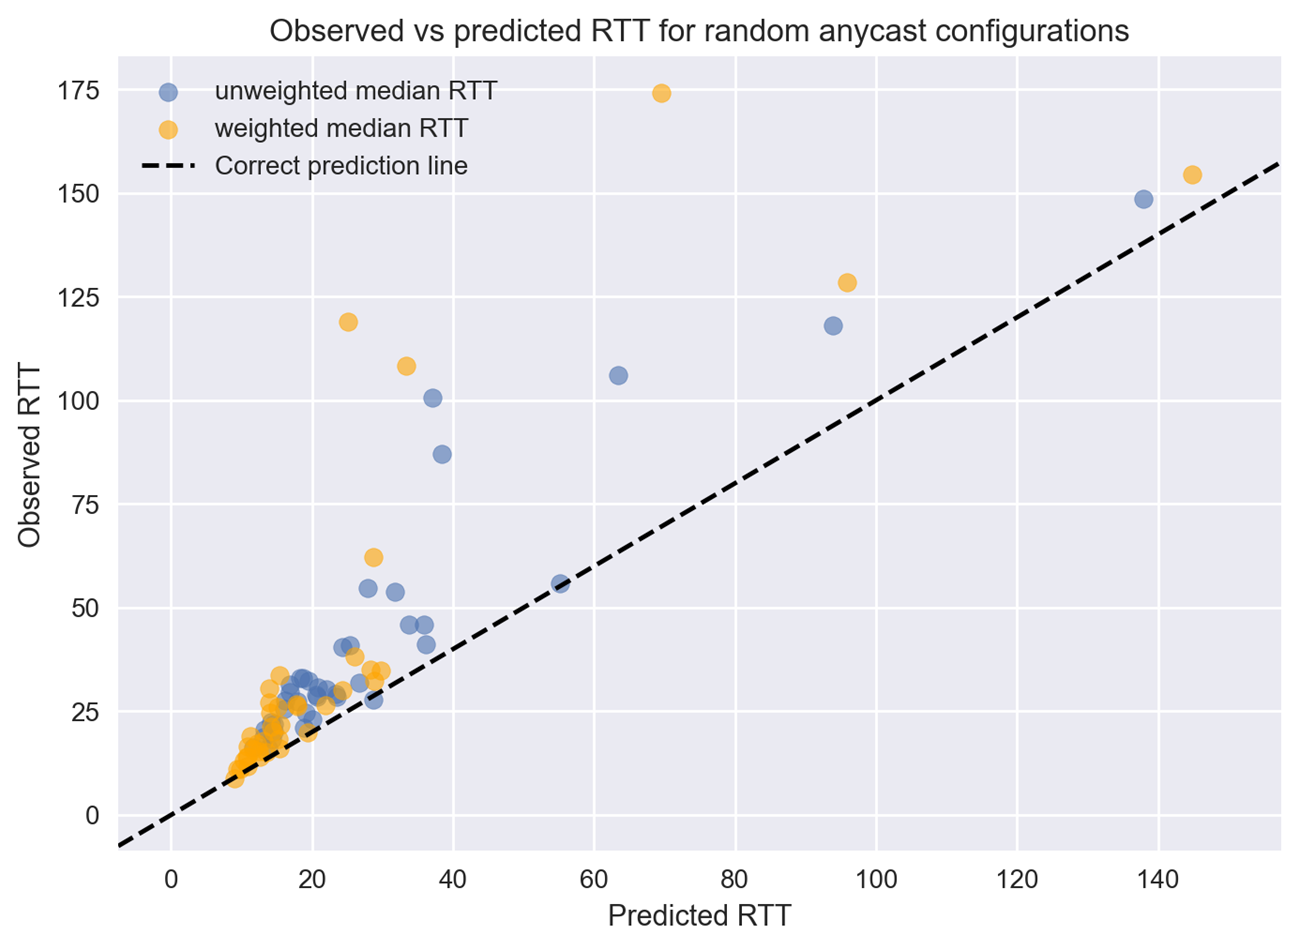
We repeated our experiments with random selections of PoPs for comparison. We evaluated random selections of 3, 5, 7, 9, 11, 13, 15, and 17 PoPs 5 times (40 configurations in total) and plot the predicted and observed median RTTs in Figure 4. The anycast deployments with random PoP selections perform much worse than the optimised selections, which is to be expected. Interestingly, the error between the predicted and observed latency of the deployments was much larger than we measured for the optimal selections of PoPs. The error between the predicted global latency and the true observed latency is larger for the random selections of sites. This means the assumption on which we base our catchment and latency prediction does not hold as well for anycast deployments that are not well optimised. For example, an anycast deployment without sufficient global coverage, or one with no presence in client hotspots.

We quantify to what extent assumption 1 holds by looking at how often resolvers indeed go to the fastest anycast PoP. On average over all optimal anycast configurations generated by Autocast, assumption 1 is violated for 26.8% of resolvers, or for 11.8% of DNS queries if we consider how many queries each resolver sends. For the randomly selected deployments, these percentages are 40.8% and 34.5% respectively, indeed significantly worse. Those numbers will vary depending on the number of PoPs that are included in the unicast latency measurement and depending on the upstream and transit providers used by the infrastructure provider. With more PoPs, there is a higher chance that a resolver is routed to a suboptimal PoP, but the error in their predicted latency may also be smaller.
We could reformulate assumption 1 to assume clients connect to the server with the smallest number of network hops, estimated by the IP TTL field in the response, instead of the smallest latency. However, in our experiments, the smallest estimated number of hops was less predictive of catchment than the round-trip time. That can be explained by internet packets traversing multiple internal networks, which are not represented in the TTL value.
The first assumption remains the biggest limitation to our method. Nevertheless, it is apparent that, for optimal anycast deployments generated by Autocast, we can still predict the performance of the entire anycast deployment with confidence.
Assumption 2 holds well in all cases, with a median difference between unicast and anycast RTT to the same site of 0.06ms (μ=0.29ms, σ=14.6ms, Cohen’s d=0.02, sample size of 284K).
The results of our experiments show that we can indeed approximate optimal site selection for anycast deployments and predict their expected median latency based solely on a unicast latency measurement with all available points of presence. Operators of anycast deployments can use Autocast to quickly and accurately obtain a selection of anycast sites that performs well, while not having to empirically test many anycast deployments manually. They can also use the measurement tool and infrastructure to simulate changes to their current anycast deployments to identify improvements or to see what happens to catchments when anycast sites are removed or added to a deployment.
We will continue to work closely with our DNS operations team to apply this method in practice when setting up anycast authoritative DNS services for .nl.
We will also test how well our method holds up when using multiple infrastructure providers at the same time. For example, it may be the case that assumption 1 is violated more often when using a mix of infrastructure providers because of possible preferences for certain upstream providers over others in BGP. Additionally, we will investigate improving the catchment and latency predictions by incorporating anycast latency measurements. They enable us to see which sites “steal” clients from sites with lower latencies. That information could be incorporated to improve catchment prediction and thereby the efficacy of our method.
Colleagues at the University of Twente are writing a paper describing the newly improved measurement tool that forms that basis of all the measurements we performed for this research. We are contributing to the paper by validating the tool in practice. The tool will be made available when that paper is published.
If you have any questions regarding Autocast, please feel free to reach out to us on sidnlabs@sidn.nl!


